In 1960, Guatemala ranked as the 11th economy in wealth per person within the Central American and Caribbean bloc. By 2024, it had fallen to 27th out of 30.
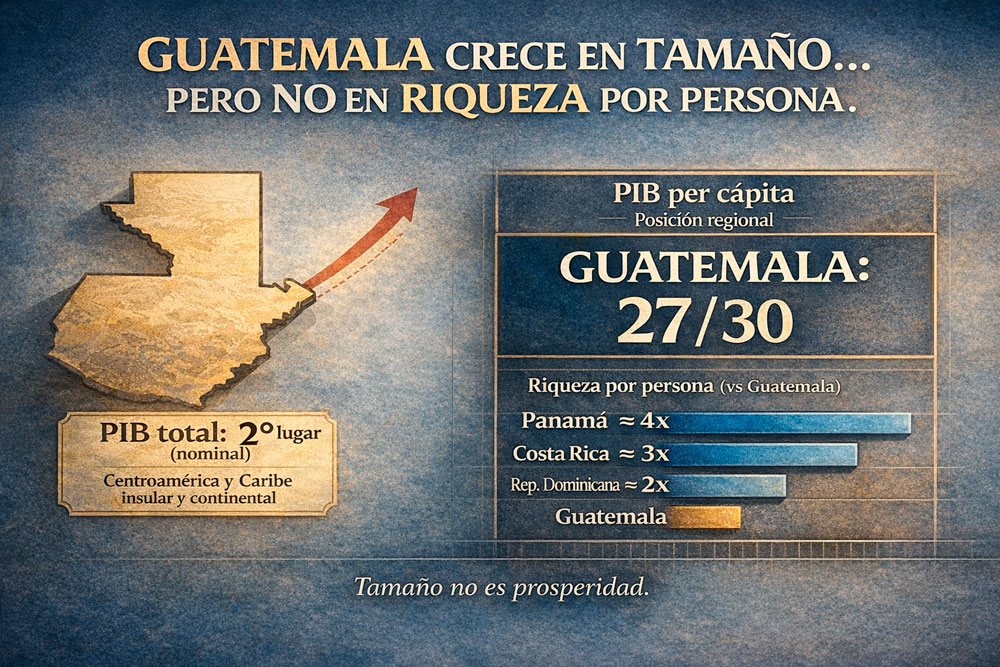
However, during the first weeks of February, several government-aligned media outlets — beginning with Diario de Centro América — celebrated the IMF projection according to which Guatemala would position itself in 2026 as the second-largest economy in the region, a grouping that includes Central American and insular and continental Caribbean countries. Spokespersons, accounts aligned with the government, think tanks, consultancies, and even some institutions joined the celebration. And of course, who would not want to applaud a “second place”?
The problem is that this narrative confuses what grows in size with what progresses in wealth per person. That “rise” occurs, to a large extent, because Puerto Rico is stagnating. In practice, we are celebrating surpassing an island economy with fewer than 3 million inhabitants and weak growth. It is not a structural achievement: it is a statistical mirage.
The IMF measurement is constructed in nominal values, meaning it mixes real growth with inflation and price effects. By contrast, when we use World Bank data in constant values, we can compare real production over time and observe how much is actually generated beyond inflationary effects. That is where the mirage dissolves: we confuse size with prosperity, population with productivity, volume with progress.
And what truly defines development is not volume, but speed. Speed determines the accumulation of wealth, the sustained fight against poverty, and the creation of opportunities for millions of people.
In real terms, Guatemala has for decades been one of the largest economies in the bloc. In 1960 it appeared in second place in size, behind Puerto Rico. Later, with Cuba’s incorporation into the series, we moved to third place. In 2006 we fell to fourth when the Dominican Republic surpassed us, and in 2024 we recovered third place by overtaking Cuba. But focusing our attention on Cuba and Puerto Rico — island economies with smaller populations and, to varying degrees, stagnation — distracts us from the indicator that reveals our true performance.
When we measure real production per person, Guatemala falls to 27th out of 30. And when we observe the recent trajectory, the difference becomes even more evident. Between 2010 and 2024, the Dominican Republic grew on average 3.3% annually per person; Panama 3.2%; Costa Rica 2.5%; El Salvador 2.0%; while Guatemala barely reached 1.7%. Put without technical jargon: while some advance at twice the speed, we walk. And over decades, that difference does not merely become noticeable; it accumulates.
The historical decline is dramatic. In 1960 we occupied position 11 in wealth per person. Thirty years later we had fallen to position 20. By 2010 we were already in position 26, and in 2023 we dropped to 27, surpassing only Honduras, Nicaragua, and Haiti in the entire region. In other words, despite our celebrated macroeconomic growth, we have remained among the laggards in terms of generating wealth per person.
Wealth per person is the accumulated reflection of decades of institutional decisions. Over time, speed changes outcomes. Today, Panama has a GDP per capita almost four times ours, Costa Rica three times, the Dominican Republic double, Belize 40% more, and El Salvador has already surpassed us. We only continue to outperform Honduras, Nicaragua, and Haiti in the entire region. Guatemala is trapped in a low-growth-per-person regime. These results are not accidental; they are structural.
When others grow at twice our pace, the gap becomes exponential. Catching up to Panama is not a matter of enthusiasm, but mathematics. If Panama maintains real per capita growth close to 3.2% annually, Guatemala would have to sustain per capita growth on the order of 11–12% annually for fifteen years to catch it. Even over a twenty-year horizon we would need close to 10% annually. Those are exceptional rates. Singapore, South Korea, and Ireland achieved them during specific periods, but with profound transformations of their productive models. Even if Guatemala grew at 6% annually per person — more than three times our recent average — it would take between 45 and 50 years to converge with Panama.
And this is not an academic exercise. Wealth per person translates into concrete realities. In tourism, the Dominican Republic received 11.2 million visitors in 2024; El Salvador 3.9 million; Guatemala around 3 million. Panama moves almost three times more port cargo than we do and records multiple times more passengers in its main airport. Costa Rica exports more, attracts more foreign investment, and consolidates higher value-added sectors. It is not a matter of population size; it is economic efficiency. And in efficiency, the countries with higher wealth per person have been leaving us behind.
The divergence also translates into human development. Panama ranks far above Guatemala globally. In schooling, the difference is overwhelming: while they approach 11 average years of education, Guatemala does not reach six. That gap conditions destiny. In the poorest quintile, completing secondary school remains an exception in Guatemala and the norm in the bloc’s more dynamic economies. The same occurs in health: infant mortality in Costa Rica and Panama moves within ranges close to developed countries, while Guatemala remains significantly higher.
In poverty, the differences are even more eloquent. Costa Rica has practically eradicated extreme poverty measured under international standards; the Dominican Republic and Panama reduce it steadily; Guatemala maintains figures that double or triple those of the leading countries in the region. In chronic child malnutrition, while Costa Rica, Panama, and the Dominican Republic are below 10%, Guatemala hovers around 46%. These figures are not ideological: they describe living conditions.
Added to this is an impossible-to-ignore reality: more than three million Guatemalans have migrated in search of opportunities, foreign direct investment remains low compared to the region, and more than 70% of our economically active population prefers to operate in informality. People do not migrate because of statistics; they migrate because of the lack of speed in the creation of opportunities.
Guatemala does not need more applause for its size. It needs speed. It needs productivity. It needs institutions capable of multiplying opportunities per person, not headlines that inflate aggregate figures.
Because in the end, territories do not compete: trajectories compete. And ours, for decades, has been one of relative deceleration.
At Factoría Libertatis we have studied what the countries that managed to change that trajectory and accelerate their GDP per capita for entire generations did. From that analysis emerges “The Recipe for Regional Leadership Guatemala 2040,” a framework of 14 strategies aimed at breaking the low-growth-per-person regime. In the coming columns I will share those experiences — not as magic formulas, but as institutional decisions that transformed destinies — so that we stop celebrating nominal positions and begin building real prosperity.
Ramiro Bolaños, PhD. / President of the Center for Thought and Action: Factoría Libertatis.
References:
Diario de Centro América. 2026. “Guatemala Will Be the Second Economy in the Region.” Diario de Centro América, February 19, 2026. https://dca.gob.gt/noticias-guatemala-diario-centro-america/guatemala-sera-segunda-economia-en-la-region/ [Accessed February 22, 2026].
Infobae Guatemala. 2026. “IMF: Guatemala Will Consolidate Its Position as the Second Economy in Central America and the Caribbean.” Infobae Guatemala, February 20, 2026. https://www.infobae.com/guatemala/2026/02/21/fmi-guatemala-consolidara-su-posicion-como-segunda-economia-de-centroamerica-y-caribe/ [Accessed February 22, 2026].
IMF. 2025. “World Economic Outlook (October 2025) – Real GDP Growth.” DataMapper/NGDP_RPCH. https://www.imf.org/external/datamapper/NGDP_RPCH@WEO/OEMDC/ADVEC/WEOWORLD/MEQ [Accessed February 22, 2026].
World Bank. 2025. World Development Indicators: GDP (constant 2015 US$), indicator code NY.GDP.MKTP.KD. World Bank, Washington, DC. Available at: World Development Indicators (WDI). https://data.worldbank.org/indicator/NY.GDP.MKTP.KD [Accessed February 22, 2026].
World Bank. 2025. World Development Indicators: GDP per capita (constant 2015 US$), indicator code NY.GDP.PCAP.KD. World Bank, Washington, DC. Available at: World Development Indicators (WDI). https://data.worldbank.org/indicator/NY.GDP.PCAP.KD [Accessed February 22, 2026].
World Tourism Organization (UNWTO). (2025). UNWTO Tourism Statistics Database. Madrid: UNWTO. (Data on international tourist arrivals 2024 for the Dominican Republic, El Salvador, Guatemala, Panama, and Costa Rica).
Panama Civil Aviation Authority. (2025). Passenger Traffic Statistics 2024. Panama City: AAC.
Guatemala Directorate General of Civil Aeronautics. (2025). Statistical Bulletin of Air Transport 2024. Guatemala: DGAC.
UNCTAD. (2024). Review of Maritime Transport 2024. Geneva: United Nations Conference on Trade and Development. (Indicator: Container port throughput, TEU for Panama, Costa Rica, the Dominican Republic, and others).
World Bank. (2025). World Development Indicators. Washington, DC: The World Bank. Exports of goods and services (current US$), code NE.EXP.GNFS.CD (Costa Rica and Guatemala, latest available data).
World Bank. (2025). World Development Indicators. Washington, DC: The World Bank. Foreign direct investment, net inflows (BoP, current US$), code BX.KLT.DINV.CD.WD (Guatemala, Costa Rica, Panama, and the Dominican Republic, 2016–2023).
United Nations Development Programme – UNDP. (2024). Human Development Report 2024. Country Data. New York: UNDP.
(Indicators: Human Development Index and ranking; expected years of schooling and average years of schooling; infant mortality per 1,000 live births).
UNESCO Institute for Statistics. (2024). UIS.Stat – Education Database. Montreal: UNESCO.
(Indicators: completion rate, lower and upper secondary, by income quintiles, latest available year for Guatemala, Panama, Costa Rica, the Dominican Republic, and El Salvador).
UNICEF. (2024). State of the World’s Children 2024 – Statistical Tables. New York: UNICEF.
(Indicator: Under-five mortality rate and infant mortality rate for Costa Rica, Panama, Guatemala, and El Salvador).
World Bank. (2025). Poverty and Inequality Platform (PIP). Washington, DC: The World Bank.
(Indicator: Poverty headcount ratio at US$6.85 a day (2017 PPP) (% of population) for Costa Rica, the Dominican Republic, Panama, El Salvador, and Guatemala, latest available years).
United Nations / FAO / IFAD / UNICEF / WFP / WHO. (2024). The State of Food Security and Nutrition in the World 2024. Rome: FAO.
(Indicator: Prevalence of undernourishment (% of population) for Costa Rica, Panama, the Dominican Republic, Belize, El Salvador, and Guatemala).
International Organization for Migration – IOM. (2024). Migration Profile: Guatemala 2023. Geneva: IOM.
International Labour Organization – ILO. (2023). Labour Overview of Latin America and the Caribbean 2023. Lima: ILO. (Indicator: Informal employment rate as a percentage of total employment, Guatemala).
Factoría Libertatis. (2025). The Recipe for Regional Leadership: Guatemala 2040. Fourteen Strategies to Grow at 7% Annually. Guatemala: Center for Thought and Action Factoría Libertatis.